
Medicare Advantage (MA) and Part D Plan Preview 2 has come to a close. So, what have we learned?
We wrote an in-depth primer on Plan Preview prior to the season launching. Coming out of Plan Preview 1, we saw a few developments and underscored some best practices for plans. Those recommendations can be seen here: https://lilacsoftware.com/learnings-from-the-field-medicare-advantage-plan-preview-1/ .
As for Plan Preview 2, it is really focused on two things:
- Validating that corrections requested and agreed to by the Centers for Medicare and Medicaid Services (CMS) were made and updated. Plan Preview 2 can also be used to continue any appeals previously filed or for new issues that arise related to calculations.
- Reconciling your assumptions on cut points, measure ratings, and overall ratings and ensuring the integrity of the calculations.
What are the global trends seen in Plan Preview 2 based on cut points and averages?
We have identified some trends coming out of Plan Preview 2. In general, they are:
- Between Measure Year 2023 and Measure Year 2024, it appears the Stars performance funk is somewhat going away. Cut points and averages rose more than not and that signals some sort of a recovery in the industry. Just how much remains to be seen.
- Even with improvement, plans still struggle with many Star areas and this is holding many plans back.
- It appears that interoperability will pose major challenges to many plans.
- The combination of better plan performance, as well as the vagaries of the impact of guard rails and Tukey, mean many measure cut points are at their highest level.
Let’s deep dive into some of this now.
Overall trends summary
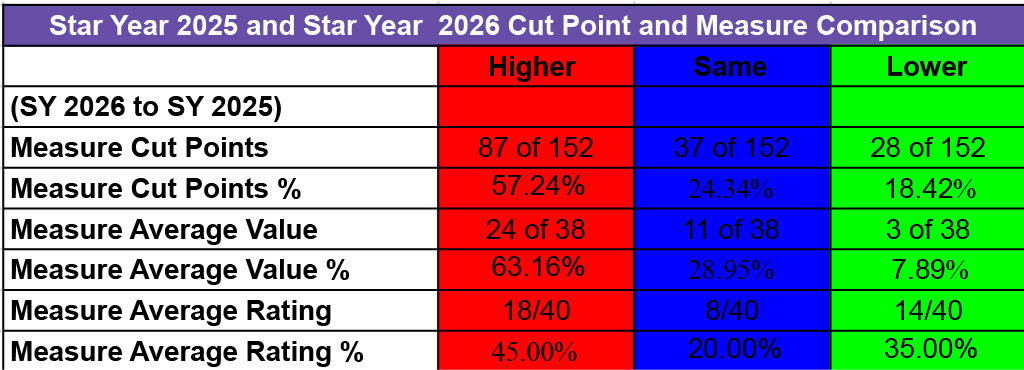
The chart above shows the progress made by plans. To ascertain performance progress, our data analysts at Lilac Software looked at three things — cut point changes, average value changes, and average rating changes. The table below summarizes our findings:
- Cut Point changes – Signaling better performance, almost 60% of cut points rose or became harder. Not all of that is strictly tied to better performance in measure year 2024. Other factors, including latency from Tukey’s impact and guardrail restrictions, can impact cut points from year to year as well. But generally, better performance in measure year 2024 or before has contributed to rising cut points. Fully 87 of 152 cut points for returning measures from MY 2023 went up, with 37 remaining the same. That is over 80% of cut points that did better or stayed the same. Just 18% or so had cut point declines. 4 Star and 5 Star cut points also had about 80% of each improve or stay the same. Cut point declines came in several flavors:
- An across-the-board erosion of cut points for Colorectal Cancer, Annual Flu Vaccine, Special Needs Care Management, and Medicare Plan Finder. We discuss many of these later.
- Separately, some weakness at 5 Star cut points (and some 4 Star as well), indicating challenges even by high-performing plans to constantly excel on some measures.
- Similarly, some challenges at the low end of cut points by poor performing plans on some measures.
- Average value performance – I am a bit suspicious sometimes of how CMS calculates average values but, like with cut points, average values increased overall. About 63% of average values increased and 29% stayed the same. In this case about 92% of average values increased compared with 82% of cut points. Just three measures saw average value decreases – Colorectal Cancer, Annual Flu Vaccine, and Complaints (a lower is better measure). Again, this broadly indicates better performance throughout the industry.
- Average rating performance –Average ratings generally improved less on average than average values. This is because average ratings are influenced by other factors, including measure clustering and cut point setting. In essence, relative performance improvement is somewhat flatter although better. About 45% of measure average ratings improved, about 20% stayed he same, and about 35% measures dropped. So, you can see any overall improvement could be minor.
Cut point change specifics
Lilac undertook a major analysis of cut points. We found the following:
- 87 of 152 cut points increased
- 37 of 152 cut points stayed the same
- 28 of 152 cut points declined
In terms of measure groupings we found the following:
- Member-based clinical measures improved markedly for the most part.
- What we call the poorly-performing complex clinical, event-based measures – readmissions, follow-up ED, transitions of care, and medication reconciliation post-discharge (last being retired) – are beginning to show signs of improved performance.
- CAHPS survey measures by and large had cut points that improved or stayed the same. The same can be said for HOS measures. But in this category, changes were more muted.
- Many operational measures’ cut points saw major increases, although we did see notable problems for some measures.
- The lower-performing medication adherence measures saw cut points improve, while the statin measures remained more stable.
As I noted, prior improvement was limited by guardrail restrictions. At least 12 measures have additional guardrail latency that will be recognized in SY 2027 and beyond. Here is a quick summary:
| Measure |
SY 2025 Cut Points |
SY 2025 Cut Points
No Guardrails |
SY 2026
Cut Points |
SY 2026 Cut Points No Guardrails |
| BCS |
53/67/75/82 |
58/67/75/82 | 58/71/76/84 |
63/71/76/84 |
| COA-MR |
53/80/92/98 |
81/86/92/98 | 58/85/93/98 |
81/86/93/98 |
| COL |
53/65/75/83 |
58/67/75/83 | 48/60/70/78 |
41/60/70/77 |
| EED |
57/70/77/83 |
62/70/77/83 | 60/72/80/86 |
NA |
| GSD |
49/72/84/90 |
69/78/84/90 | 54/77/87/91 |
73/83/87/91 |
| Reviewing Appeals |
78/92/96/99 |
88/92/96/99 | 83/96/98/100 |
92/96/98/100 |
| Timely Appeals |
69/85/95/99 |
87/91/95/99 | 74/90/99/100 |
96/98/99/100 |
| Call Center Part C |
46/69/93/100 |
89/94/97/100 | 51/74/97/100 |
86/94/97/100 |
| Call Center Part D |
40/74/90/100 |
85/92/96/100 | 45/79/95/100 |
90/94/97/100 |
| Complaints (2 measures) |
1.39/0.76/0.37/ 0.12 |
0.66/0.44/0.24/
0.12 |
1.34/0.71/0.32/
0.11 |
0.68/0.46/0.26/ 0.11 |
| MPF |
97/98/99/100 |
NA | 92/93/94/99 |
99 or less = 4; 100 = 5 |
Average value and average rating change specifics
Lilac undertook a major analysis of average values and ratings. We found the following:
- 24 of 38 average values increased
- 11 of 38 average values stayed the same
- 3 of 38 average values declined
In terms of measure groupings we found the following on average values:
- For member-based HEDIS measures, all but Colorectal Cancer Screening saw increases in the average value.
- For the complex clinical, event-based measures, all four saw nice increases in their average values.
- CAHPS and HOS average values largely stayed the same.
- Operational measures largely saw increases in their average values.
- Drug measures also saw modest increases in their average values.
Showing relative performance differences, we found the following on average ratings:
- Member-based HEDIS measures were more mixed on average ratings, with about half increasing and half staying the same or declining. The same is true for the complex clinical, event-based measures.
- A majority of CAHPS survey measures stayed the same or declined in terms of average ratings. HOS was mixed.
- Operational results were mixed but more had average rating increases than not.
- Statin measures saw average rating increases, while medication adherence measures were flat or dropped.
Deep dive into measure performance
As I noted earlier, some of the performance improvement was in measure year 2024 but also prior. Prior improvement was limited by guardrail restrictions.
HEDIS clinical measure improvements – Perhaps the standout news of Plan Preview 2 was the performance changes for a series of HEDIS clinical measures, most notably BCS, COA-MR, COA-PA, GSD, and EED. Generally, cut points increased somewhat dramatically across the board for these measures. Average values increased by one or more points. These changes, however, did not readily translate into increases in average ratings. CBP saw its average values and rating increase considerably. The CBP 2-point cut point dropped while the others increased by 1 or remained the same.
PCR, FMC, TRC – Plans too may be making investments in these measures and it shows. FMC saw major cut point changes across the board. Transitions of Care saw nice progress for the 3 Star and greater. PCR saw reasonable progress, but especially at lower Stars. This resulted in increases in average values, but FMC and PCR saw lower average ratings.
COL – Colorectal Cancer Screening moved from a hybrid measure in MY 2023 to an electronic (ECDS) measure in MY 2024. This caused a major decline in cut points, with all dropping by 5 points. The 2 Star and 5 Star cut points would have dropped even more without guardrail limits. The published average value dropped from 73 to 71, but that small drop is a bit hard to really understand. And the published average rating went up from 3.4 to 3.8. That is a result of the guard rails and other factors.
Many argue that CMS should have considered the measure substantially changed and not applied guardrails. This is not what the regulations say, though. A precedent to guardrail ECDS conversions as “no substantial change” occurred for BCS in MY 2023. But BCS was an administrative measure and the performance on conversion was not significantly different. But COL was a hybrid measure, subject to a sample and both administrative and chart review claims. Now, under ECDS, COL was limited to electronic sources across the entire population. It is difficult to understand how that was not substantive.
Obviously, many plans dropped well more than 5 points. The new measure results should have floated (been re-clustered) based on the new performance and not be subject to guardrails. The move to treat the measure as a non-substantive change hurts most plans in SY 2026 but especially hurts those that saw their values rise and planned for the change. It especially takes the winds out of the sails of the drive for interoperability and penalizes plans in states that have mature interoperable and electronic systems. I raise this because ECDS continues its rollout (GSD and CBP are in a few years), and CMS’ decision is unfair and makes little sense.
Note that the measure will be treated as new measure in MY 2025/SY 2027 due to age band expansion and will have no guardrails. It is ironic as the changes look less substantive than the ECDS conversion.
Annual Flu Vaccine drops – While most CAHPS measures had uneventful changes, the exception was Annual Flu Vaccine. Cut points were down 3 to 5 points each. One theory is post-COVID vaccine skepticism could be setting in for seniors and those with disabilities. The average value dropped by 3 points while the average rating stayed the same.
Appeals and call center measures surging – Plans clearly focused on the two Part C appeals measures as most cut points soared in most cases, but especially at the lower end. The average values increased but average ratings stayed the same or decreased. Both call center measures had surging cut points at the 2 trough 4 Star levels as well as major increases in average values and ratings.
Complaints – Complaints saw falling cut points (lower is better) at the 2 through 4 Star levels, but average values and ratings eroded a little.
Special Needs Plan (SNP) Care Management – SNP-CM actually had its average value and ratings go up slightly, but cut points dropped for each cut point, mostly at the lower end. This could be a sign that some plans are struggling with the huge surge in enrollment and completing required health risk assessments.
Disenrollment – The Leave measure cut points dropped for the 2 and 3 Star cut points, while they stayed the same at 4 and 5. Overall, both the average value and rating improved slightly. The cut point drops are a signal that some plans could be struggling with major enrollment growth and added flux, while others have better mastered member management. It should also be noted that there was an important Technical Notes change. The document says CMS will not count a disenrollment against a contact if the disenrolled member moves to an Applicable Integrated SNP plan. This also helped results. This change was made for the entirety of MY 2024 even though a master monthly Special Enrollment Period change for those enrolling in AIPs did not go into effect until January 1, 2025.
Medicare Plan Finder – What is happening in Medicare Plan Finder is very hard to understand. The no guardrail documentation shows that a 100 gets you a 5 Star and everything else a 4 Star. But guardrails were established given regulatory rules — . There appears almost no differentiation in the measure
Drug measures – Drug measures generally saw increases of 1 or 2 points for average values and mixed results on average ratings. Cut points on medication adherence measures went up in a big way for cholesterol at the 2 and 3 Star cut points and for Diabetes at the 2 and 4 Star cut point. Generally, all medication adherence cut points went up. Stain measures had either down or flat cut points. Overall, lower performing plans look to be improving somewhat on many drug measures.
Conclusion
Plans took their eyes off the Stars ball during COVID, which led to three years of Star performance declines – SY 2023, SY 2024, and SY 2025. But it appears the MA industry may be getting back on track for Stars. All signs lead to some improvement to be announced in October for SY 2026. How much that is is dependent on a number of factors, some of which I mention below. But performance likely still will be in the doldrums compared with historic performance as well as the recent peak in SY 2022. Again, consider that 45% of average ratings went up and 35% went down.
Factors we will watch for:
- What is the percentage of 4 Star contracts and anticipated enrollment in these plans?
- How much will plan exits impact the statistics? It stands to reason that the exiting plans or contracts in 2025 were likely lower performers on average in Star. But was their enrollment enough to meaningfully impact these statistics as members moved to remaining plans?
- How well did the big MA plans improve? They will drive most of the statistics. Public disclosure so far seems to indicate some good news at some large plans, while others have remained mum. Is that because of bad news or obligations on non-publicity right now.
One last insight: Performance on Colorectal Cancer Screening due to its conversion to ECDS shows that plans need to increase their interoperability chops as more measures ready for the conversion.
———————————————–
Interested in learning how your plan’s end of year initiatives can benefit from Lilac’s powerful analytics and agentic AI solutions? Reach out here to start a conversation with the Lilac team.